At Strategic Advisory Partners, our dedication to building personal relationships with our clients is what truly sets us apart. We’ve put in the effort to foster a two-way communication partnership because we want to be more than just a source for your monthly investment updates. Our goal is to be a trusted resource and a supportive ally on your financial journey, offering guidance and insight that goes beyond the numbers.
Lately, in our conversations with clients, we’ve noticed a recurring theme: a palpable sense of uncertainty about the future of our economy. Like all of you, we’re feeling the impact of inflation and navigating the twists and turns of our political landscape. It’s during times like these that we realize the importance of focusing on what we can control rather than what we cannot. This mindset shift isn’t just about maintaining a positive outlook; it’s about empowering ourselves to make informed decisions amidst uncertainty.
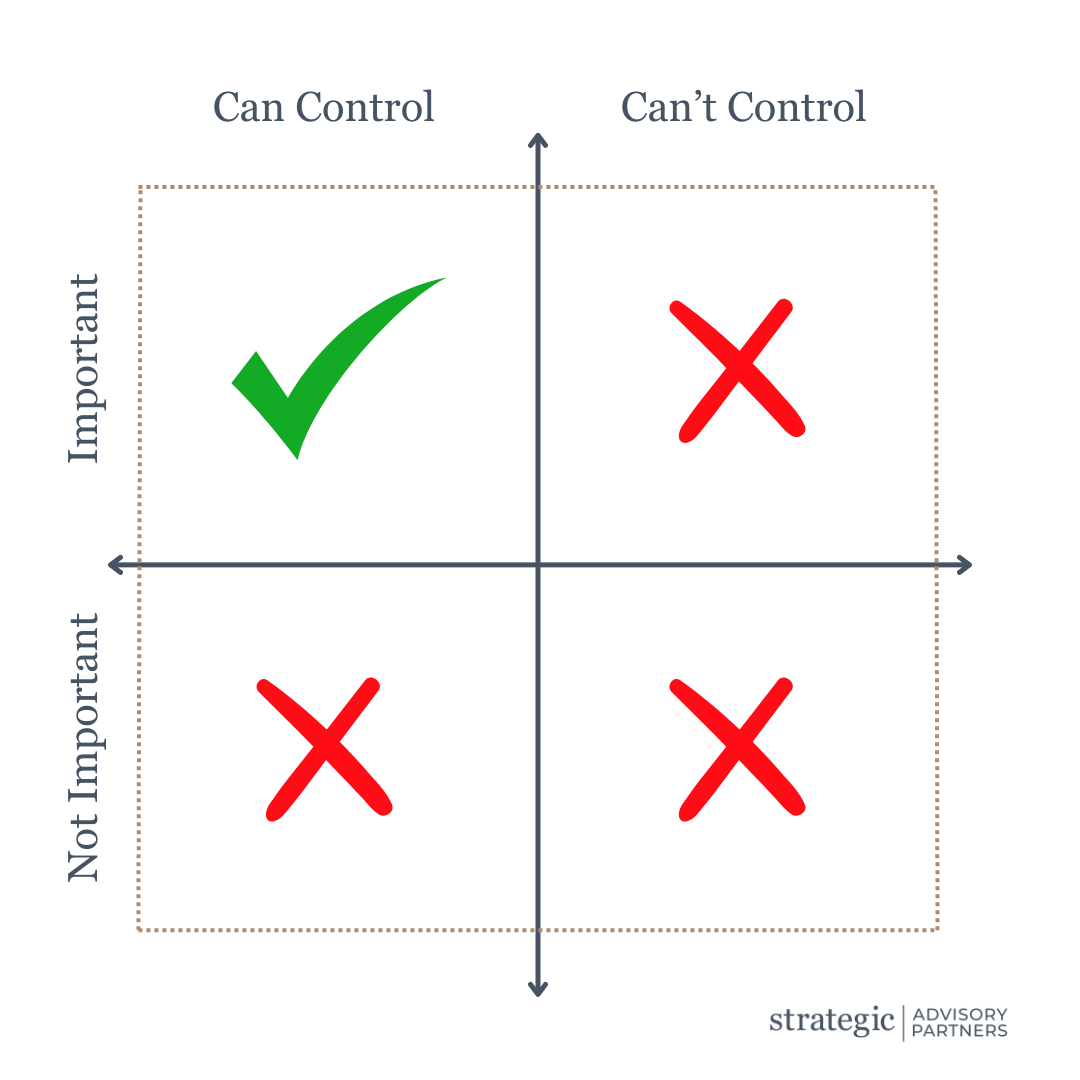
As we reflect on these discussions, we’re reminded of a valuable tool: the Control Matrix (shown below or beside, depending on desktop or mobile viewing). It’s a simple yet effective way to categorize our concerns based on their importance and our ability to influence them. It’s amazing how clarifying things becomes when you start assessing worries through the lenses of importance and controllability.
We encourage you to take a moment to think about what lands in your top left quadrant. You might discover that many worries don’t belong there after all. For us, what matters and what we can actively manage include personal finances, making healthy choices, and wisely allocating our time. These are the areas where we can have a meaningful impact on our lives and financial well-being, regardless of the external circumstances.

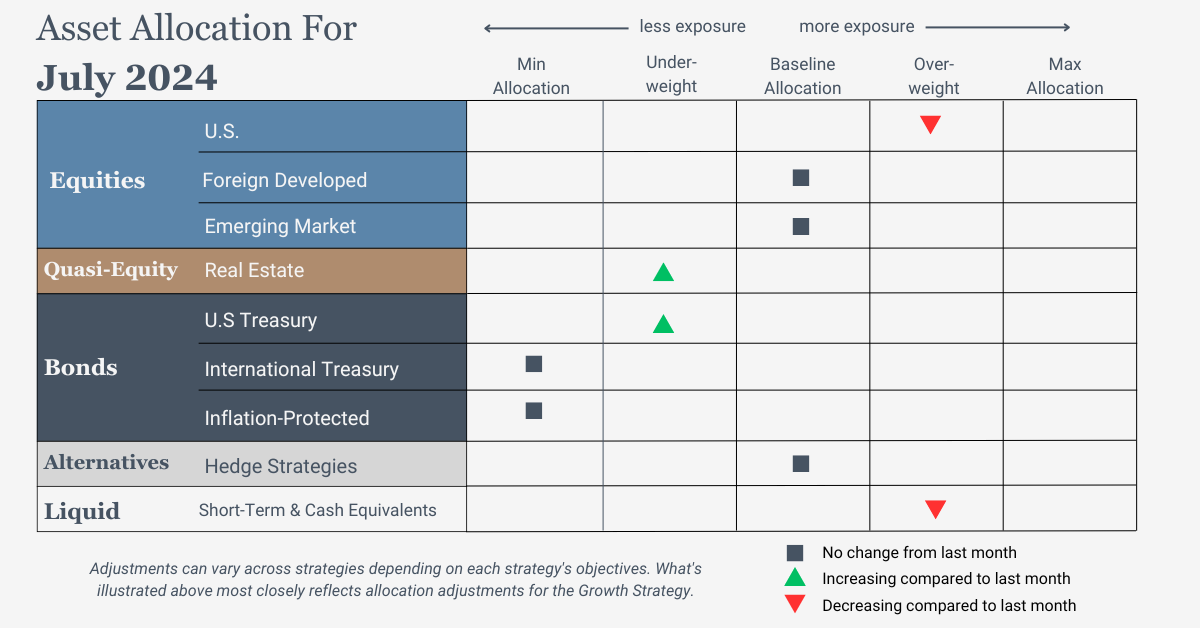
July 2024 Asset Allocation Update

What Does This All Mean?
U.S. Equities
We will slightly reduce exposure while maintaining an overweight position. Positive trends across all timeframes support its status as the strongest equity asset class. The minor adjustment in allocation aims to reintroduce exposure to real estate, which has shown notable strength.
International Equities
Exposure will not change and will stay at the baseline allocation. Trends are positive across all timeframes.
Real Estate
Exposure will increase marginally but continue to be underweight as the intermediate-term trend shifts to positive.
U.S. & International Treasuries
Exposure will increase slightly but remain underweight as trends improve.
Inflation-Protected Bonds
Exposure will not change and will remain at its minimum.
Alternatives
Our exposure will be maintained using a multi-asset alternative ETF. Presently, the allocation favors long positions in equities, short positions in fixed income, and a modest short position in commodities. In currency markets, we are positioned with a net short stance on the U.S. Dollar, while holding long positions in both the British Pound and Swiss Franc against other major global currencies.
Short-Term Fixed Income
Exposure will decrease slightly as some of the allocation is returned to modestly strengthening U.S. Treasuries.
3 Potential Catalysts for Trend Changes

Steady Fedey:
The Federal Reserve has decided to hold interest rates steady for now, but they’ve indicated a more cautious approach to future rate cuts than previously anticipated.
Key takeaways:
- One Rate Cut Expected This Year: The Fed is now projecting only one rate cut by the end of 2024, compared to the three predicted in March.
- Higher Long-Term Interest Rates: The Fed also signaled that it believes the long-run interest rate will be higher than previously thought.
- Modest Progress on Inflation: While inflation has eased, it remains elevated. The Fed expects inflation to return to its 2% target by 2026.
https://www.cnbc.com/2024/06/12/fed-meeting-today-on-interest-rate.html

Job Openings Decline:
Job openings are on the decline, signaling potential shifts in the economic landscape.
Key takeaways:
- A decrease in job openings could indicate cooling labor market conditions.
- This trend may influence unemployment rates and overall economic stability.
- Understanding the interplay between job openings, inflation, and interest rates can help keep you more informed about the state of the economy.

Oil Prices Gain:
Crude oil futures surged 2% on Thursday, continuing a recent rally spurred by the European Central Bank’s interest rate cut and expectations of a Federal Reserve rate reduction in September. Wednesday’s rebound in oil prices, up over 1%, countered earlier losses following OPEC+’s supply increase announcement, fueled by disappointing private payroll data that raised hopes for Fed rate cuts. Fed futures now suggest a 70% probability of a September rate cut, which could boost economic growth and bolster oil demand. Investors and consumers should monitor these developments closely for potential impacts on inflation and global economic stability amid the ongoing oil price uptrend.
“Be fearful when others are greedy and be greedy only when others are fearful.” –Warren Buffett
The stock market has been on a significant rise throughout 2023 and so far in 2024. This has been an interesting time for such a rise since many individuals feel more pressure at the individual level. This pressure has come because of rising costs for nearly all goods, rising interest rates for any borrowing, and uncertainty about how long these trends will continue.
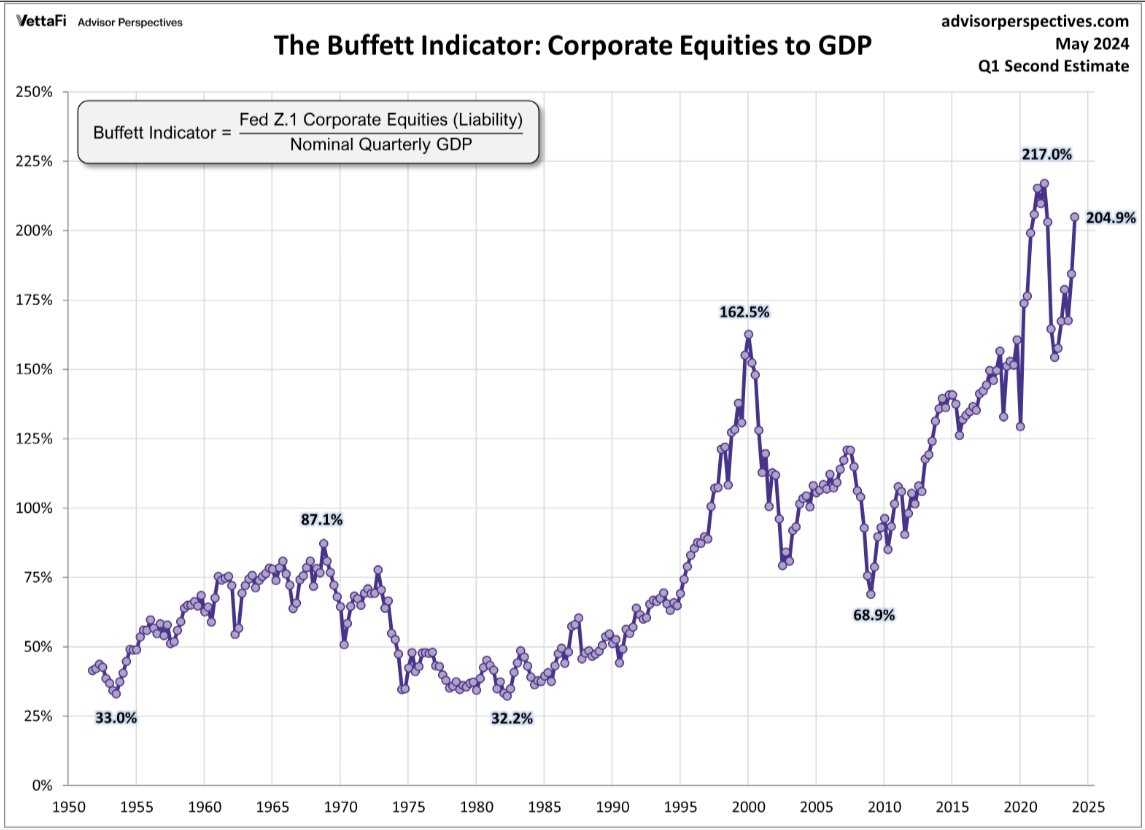
The question many people have in these times is “How long will it continue?”. There is a pretty famous market indicator used called the “Buffett indicator”. It has this name because it was originally created by Warren Buffett. This indicator is a simple ratio with one number in the numerator and another in the denominator.
The numerator shows the total value of all stocks in the United States, and the denominator shows the GDP of the United States. Buffett originally found that when this ratio starts getting greater than 1, it demonstrates a rising risk that stocks are overpriced. Because this calculation requires a GDP calculation, and those are released with a lag by the government, the most recent measure we have is a month old (from the end of May).
At the end of May the indicator was at 204.9%, or 2.049. The stock market had an increase during June, so this measure will be higher after the new data is released.

Historically speaking, we are close to the highest valuation we have ever seen using this measure. There are other measures that exist that tell similar stories.
So, what does that mean for stocks and portfolios going forward? Nobody knows with certainty what will take place going forward. However, there are different possibilities:
Stocks can still rise – and can even still rise a lot. Changes from elections, policy changes, global events, and interest rate changes could all continue to drive stock prices higher. From 1995 through 2000 stock prices first set a high in many valuation indicators, and then continued to rise for a few years. Not being invested in stocks meant people lost out on huge gains in their portfolios.
Stocks can decline – and potentially decline a lot. If stocks do decline back to historical levels for many measures used in valuation, then there could be a significant decline in valuation.
Our strategy, as always, is to watch what is happening and to have a strategy in place to make adjustments that are needed. We know that certain indicators work best when it is time to reduce how much money is held in stocks or bonds. We will continue to monitor those indicators and will make adjustments with the portfolio to grow with the stock market, as well as to manage risk when the stock market is down.

