“Beware lest you lose the substance by grasping at the shadow.” –Aeso
In this month’s Investment Update, we tackle the age-old dilemma of chasing shadows versus focusing on substance. As Aesop wisely said, ‘Beware of Grasping at the Shadow.’ We get it; the allure of being right in the markets is tempting, but let’s not lose sight of what truly matters – our systematic, consistent approach to successful investing.
No crystal balls or magical thinking here – our trend-following strategy is firmly grounded in understanding and responding to market trends. Forget about the ‘perfect moment’ to strike; we’ve got a well-calibrated compass to navigate the ups and downs of the financial landscape.
Our discipline and research keep us focused on the substance – optimizing our investment process, aiming for growth, and adapting to the ever-changing market conditions.
So, let’s dive into our latest monthly note, where we dissect the S&P 500 and Nasdaq’s performances and address the emotional biases that can cloud our judgment. We’ve got the tools to stay on track, armed with knowledge and a solid investing foundation.
Together, we’ll steer clear of shadows and focus on the substance of building a robust financial future.
Markets.businessinsider.com, “3 reasons why the stock market could hit a record high by the end of the year,” 6/21/2023; Bloomberg.com, “Wall Street Turns Bearish on Stocks After Bad Year,” 12/1/2022; and ICE, S&P 500 Index, 1/1/1990 to 6/29/2023

U.S. Equities
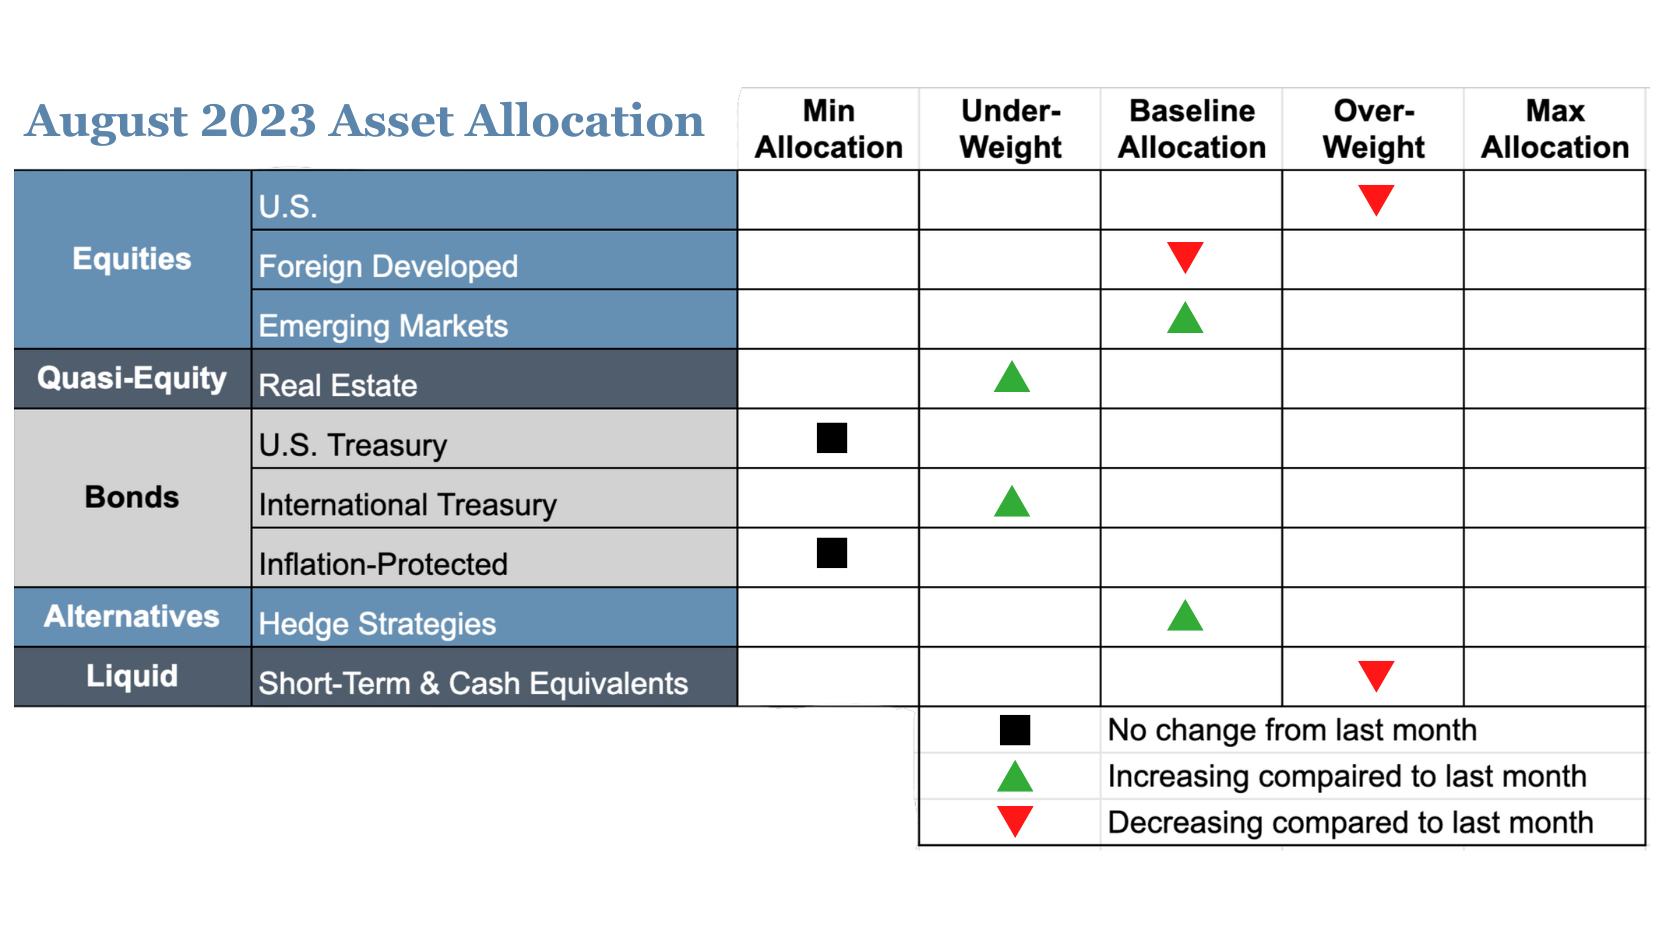
Exposure will decrease. While both the intermediate- and long-term timeframes remain in uptrends, a portion will be returned to real estate due to it strengthening slightly. Within the asset class, exposure remains skewed toward growth and large caps, which are stronger than value, small caps, and mid caps.
Intl Equities
Overall exposure will not change. Foreign-developed equities continue to experience uptrends across both timeframes, but it will return to baseline allocation due to returning a portion to emerging markets, which are experiencing uptrends across both timeframes for the first time in more than 18 months.
Real Estate
Exposure will increase as it now has an intermediate-term uptrend. The long-term trend remains negative.
U.S. & Intl Treasuries
Exposure will increase slightly but remains underweight. International bonds picked up an intermediate-term uptrend, but all other segments and trends remain negative.
Inflation-Protected Bonds
Exposure will not change and is at its minimum allocation due to downtrends across both timeframes.
Short-Term Fixed Income
Exposure will decrease, as it is handed back to other strengthening segments.
Alternatives
Exposure will increase to baseline allocation due to the emergence of an intermediate-term uptrend.
Asset Level Overview
Equities & Real Estate
In July, the U.S. equity markets continued their upward climb, with various segments, including value, high-dividend, mid, and small caps, producing robust returns. Growth and tech, which had dominated, took a backseat as other classes sought to close the performance gap from the first half of 2023. This year’s equity performance is shaping up to be one of the best in decades.
Foreign-developed equities and emerging markets also performed well, with uptrends firmly in place. Our exposure to international equities remains at baseline levels, with a slight shift towards emerging markets due to their strengthening trends.
As for real estate securities, they have shown signs of recovery with an intermediate-term uptrend, though the long-term trend is still negative. Consequently, we will increase exposure, reallocating from U.S. equities, while maintaining an overall underweight position in the asset class.
Fixed Income & Alternatives
In the fixed-income arena, returns were mixed, except for international bonds, which performed positively. Downtrends persisted, but an intermediate-term uptrend internationally will slightly increase our exposure. Our allocations will remain underweight across the board, with a focus on ultra-short duration instruments.
Lastly, gold rebounded in July, regaining uptrend status across both timeframes. This led to a return to baseline allocation in our portfolios.
Barchart.com, Growth ETF Vanguard (VUG), 1/1/2023 to 7/27/2023; Barchart.com, Nasdaq Composite ($NASX), 1/1/2023 to 7/27/2023; Barchart.com, Value ETF Vanguard (VTV), 1/1/2023 to 7/27/2023; Barchart.com, High Dividend Yield Vanguard ETF (VYM), 1/1/2023 to 7/27/2023; Barchart.com, Midcap ETF Vanguard (VO), 1/1/2023 to 7/27/2023; and Barchart.com, Smallcap ETF Vanguard (VB), 1/1/2023 to 7/27/2023
3 Potential Catalysts for Trend Changes
All Done?
The Federal Reserve and European Central Bank (ECB) made their moves this month, raising key interest rates by a quarter percentage point. For the Federal Reserve, it marked the 11th rate hike, reaching a 22-year high of between 5.25% and 5.50%. The ECB followed suit, with its ninth rate hike, reaching a 22-year high of 3.75%. As interest rates climb, we’ll keep a close eye on how this impacts the markets.
GDB Wow:
In the second quarter, gross domestic product (GDP) exceeded expectations, growing at a 2.4% annual rate, higher than the 2% growth in the first quarter. A slower consumer spending pace was balanced out by stronger business investment, all while the labor market remains robust. The report has raised hopes for a soft landing in the economy.
It’s All About the Consumer:
U.S. consumer confidence is soaring, reaching its highest level in two years. With a strong labor market and easing inflation, consumers reported increased confidence across all three measures: the overall index, future expectations, and present situation.
Let the Good Times Roll
“Man cannot control the current of events. He can only float with them and steer.” –Otto Von Bismarck
Last month, we had a good laugh at the unpredictability of market predictions. As we move forward, we find ourselves reflecting on the amusing predictions from the previous year, driven by recency bias, that anticipated continued negative performance in 2023. However, in contrast, we’ve witnessed another strong month of equity performance, sparking thoughts about where 2023’s performance fits within a historical context.
Asking ourselves, “Should we be happy or worried?” is only natural, and we’re here to provide valuable context to help answer those questions. While dwelling solely on past performance can be risky, it can also aid in maintaining what the late Trevor Moawad called “neutral thinking” in his book “It Takes What It Takes.”
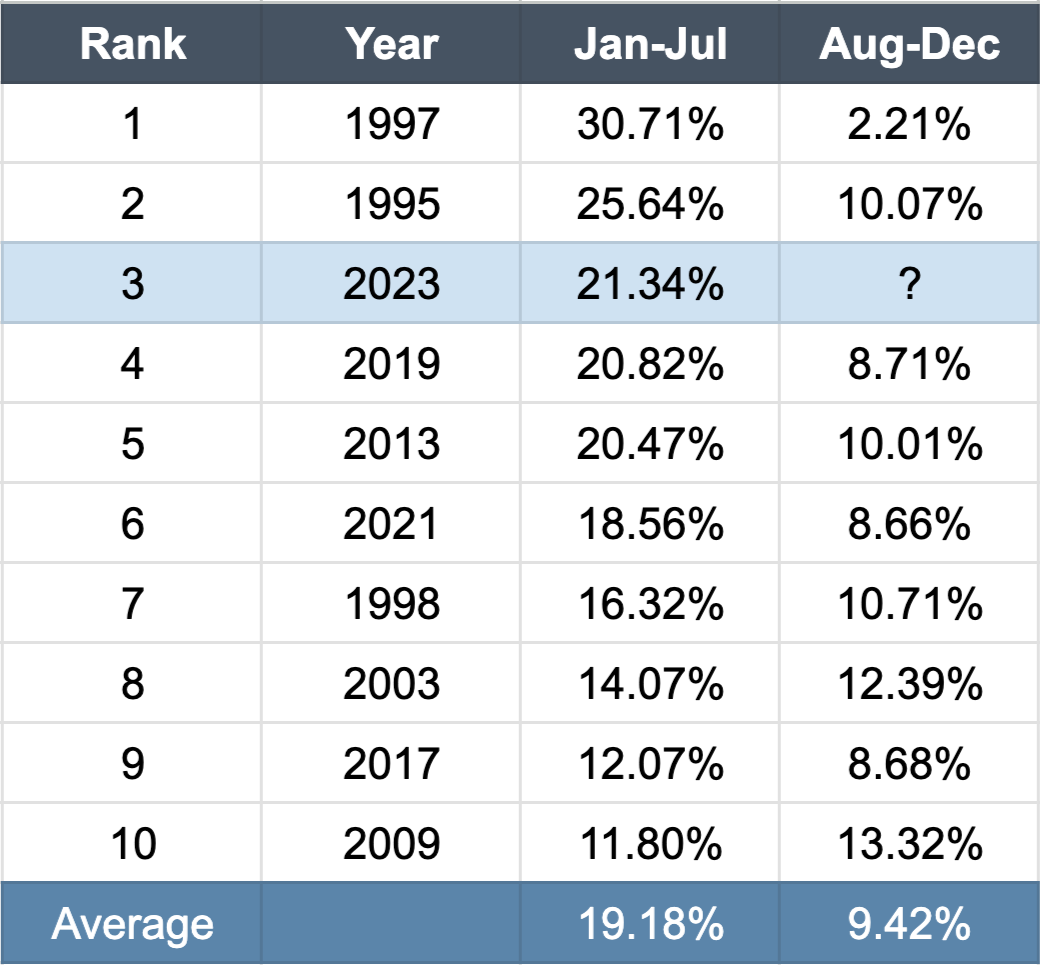
For instance, if you’ve been feeling pessimistic about the market or the economy, you might find it reassuring to know that the S&P 500 Index has experienced its third-best start in the last three decades. Understanding these historical patterns can help us navigate the current market climate with a balanced perspective.
Best Starts to the Year for the S&P 500


Source: GFD, SPDR S&P 500 ETF Trust (SPY), 2/1/1993 to 7/26/2023
The only two years better than 2023 are 1995 and 1997. The years right behind 2023 are 2019 and 2013. All four of those were very positive environments both from an economic and market standpoint.
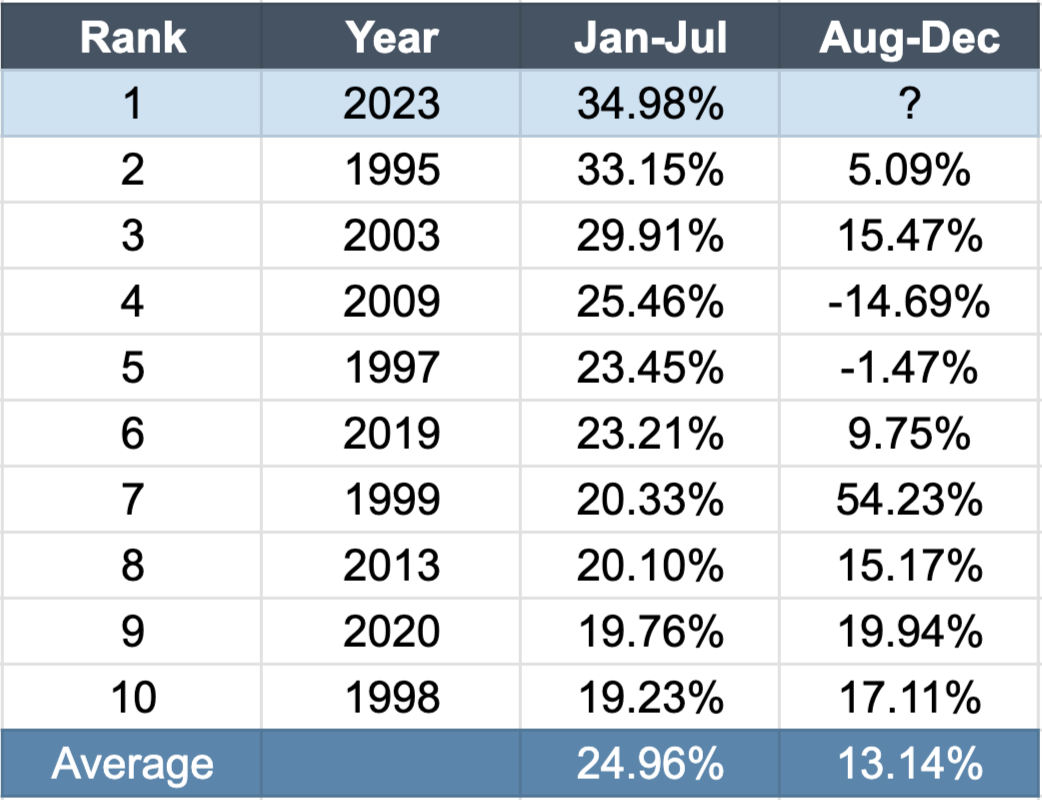
If you look at the Nasdaq, it’s even more positive. In fact, 2023 is the best start for the index over the last 30 years, with 1995 being second.
Best Starts to the Year for the Nasdaq


Source: GFD, Nasdaq Composite (^IXIC), 1/1/1993 to 7/26/2023
A Balanced Perspective: For those with a pessimistic outlook, the stellar performance of this year might stir further concerns about overvaluation. However, let’s turn to the data, which tells a different story. Among the top 10 best starts in the S&P 500 over the last 30 years, the average return from July to December stands at 9.4%, as the summarized table above shows. The Nasdaq paints a similar picture, with an average of more than 13% and a median of over 15% for the same period.
Now, before we steer our emotional vehicle from one ditch of worry and fear to the other ditch of irrational optimism and risk-taking, we must remember that predicting how the year will conclude is beyond our grasp. Fortunately, employing a systematic investing process eliminates the need for such predictions. Our system allows us to find peace in our current position, recognizing that we are likely well-positioned for the circumstances at hand, while remaining adaptable to pivot if needed.
Critiques based on biases are common when it comes to trend following. Pessimists may question our seemingly slow exit during a market drop, only to fall silent when the trend reverses. On the other hand, optimists may criticize our re-entry timing, yet be content with positioning during market downturns. It seems that some observers, who haven’t fully grasped the potential value of trend following, worry that our systematic approach could leave us in a difficult position from which recovery seems impossible.
However, what these Monday morning quarterbacks fail to realize is something we discovered two decades ago, confirmed over the subsequent years, and continue to witness in 2023: The true potential of a trend-following system lies in its ability to steadily and consistently deliver results over time. Sticking with it may take patience, but it often leads to a great position compared to the alternatives.
Disclosures:
Strategic Advisory Partners is an investment advisor registered pursuant to the laws of the state of North Carolina. Our firm only conducts business in states where licensed, registered, or where an applicable exemption or exclusion is afforded. This material should not be considered a solicitation to buy or an offer to sell securities or financial services. The investment advisory services of Strategic Advisory Partners are not available in those states where our firm is not authorized or permitted by law to solicit or sell advisory services and products. Registration as an investment adviser does not imply any level of skill or training. The oral and written communications of an adviser provide you with information about which you determine to hire or retain an adviser. For more information, please visit adviserinfo.sec.gov and search for our firm name.
Past performance is not indicative of future results. The material above has been provided for informational purposes only and is not intended as legal or investment advice or a recommendation of any particular security or strategy. The investment strategy and themes discussed herein may be unsuitable for investors depending on their specific investment objectives and financial situation.
Information obtained from third-party sources is believed to be reliable though its accuracy is not guaranteed.
Opinions expressed in this commentary reflect subjective judgments of the author based on conditions at the time of writing and are subject to change without notice.
No part of this material may be reproduced in any form, or referred to in any other publication, without express written permission from Strategic Advisory Partners.
An index is an unmanaged portfolio of specific securities, the performance of which is often used as a benchmark in judging the relative performance of certain asset classes. Investors cannot invest directly in an index. An index does not charge management fees or brokerage expenses, and no such fees or expenses were deducted from the performance shown.

