“What we hope ever to do with ease, we must first learn to do with diligence.”
–Samuel Johnson
Navigating the unpredictable terrain of financial markets often feels like scaling a daunting “wall of worry.” Whether it’s global turmoil, shifts in monetary policy, or the ever-evolving market landscape, uncertainties are an integral part of the investment landscape.
Wishing for different conditions may be tempting, but it rarely alters reality. Instead, what we can diligently achieve is to outsmart our own biases. At Strategic Advisory Partners, we accomplish this through disciplined execution of our tried-and-true investment principles. Our precise and robust process enables us to sidestep the “wall of worry,” rather than attempting to conquer it.
In this monthly note, we delve into a crucial aspect of achieving market outperformance. We shed light on how our systematic investment approach handles risk management. More specifically, our strategy for easing out of weakening asset classes while avoiding a full “risk-off” stance. It’s all about circumventing the wall, not climbing it.
Here’s a summary of our take on what transpired in the markets in August

U.S. Equities
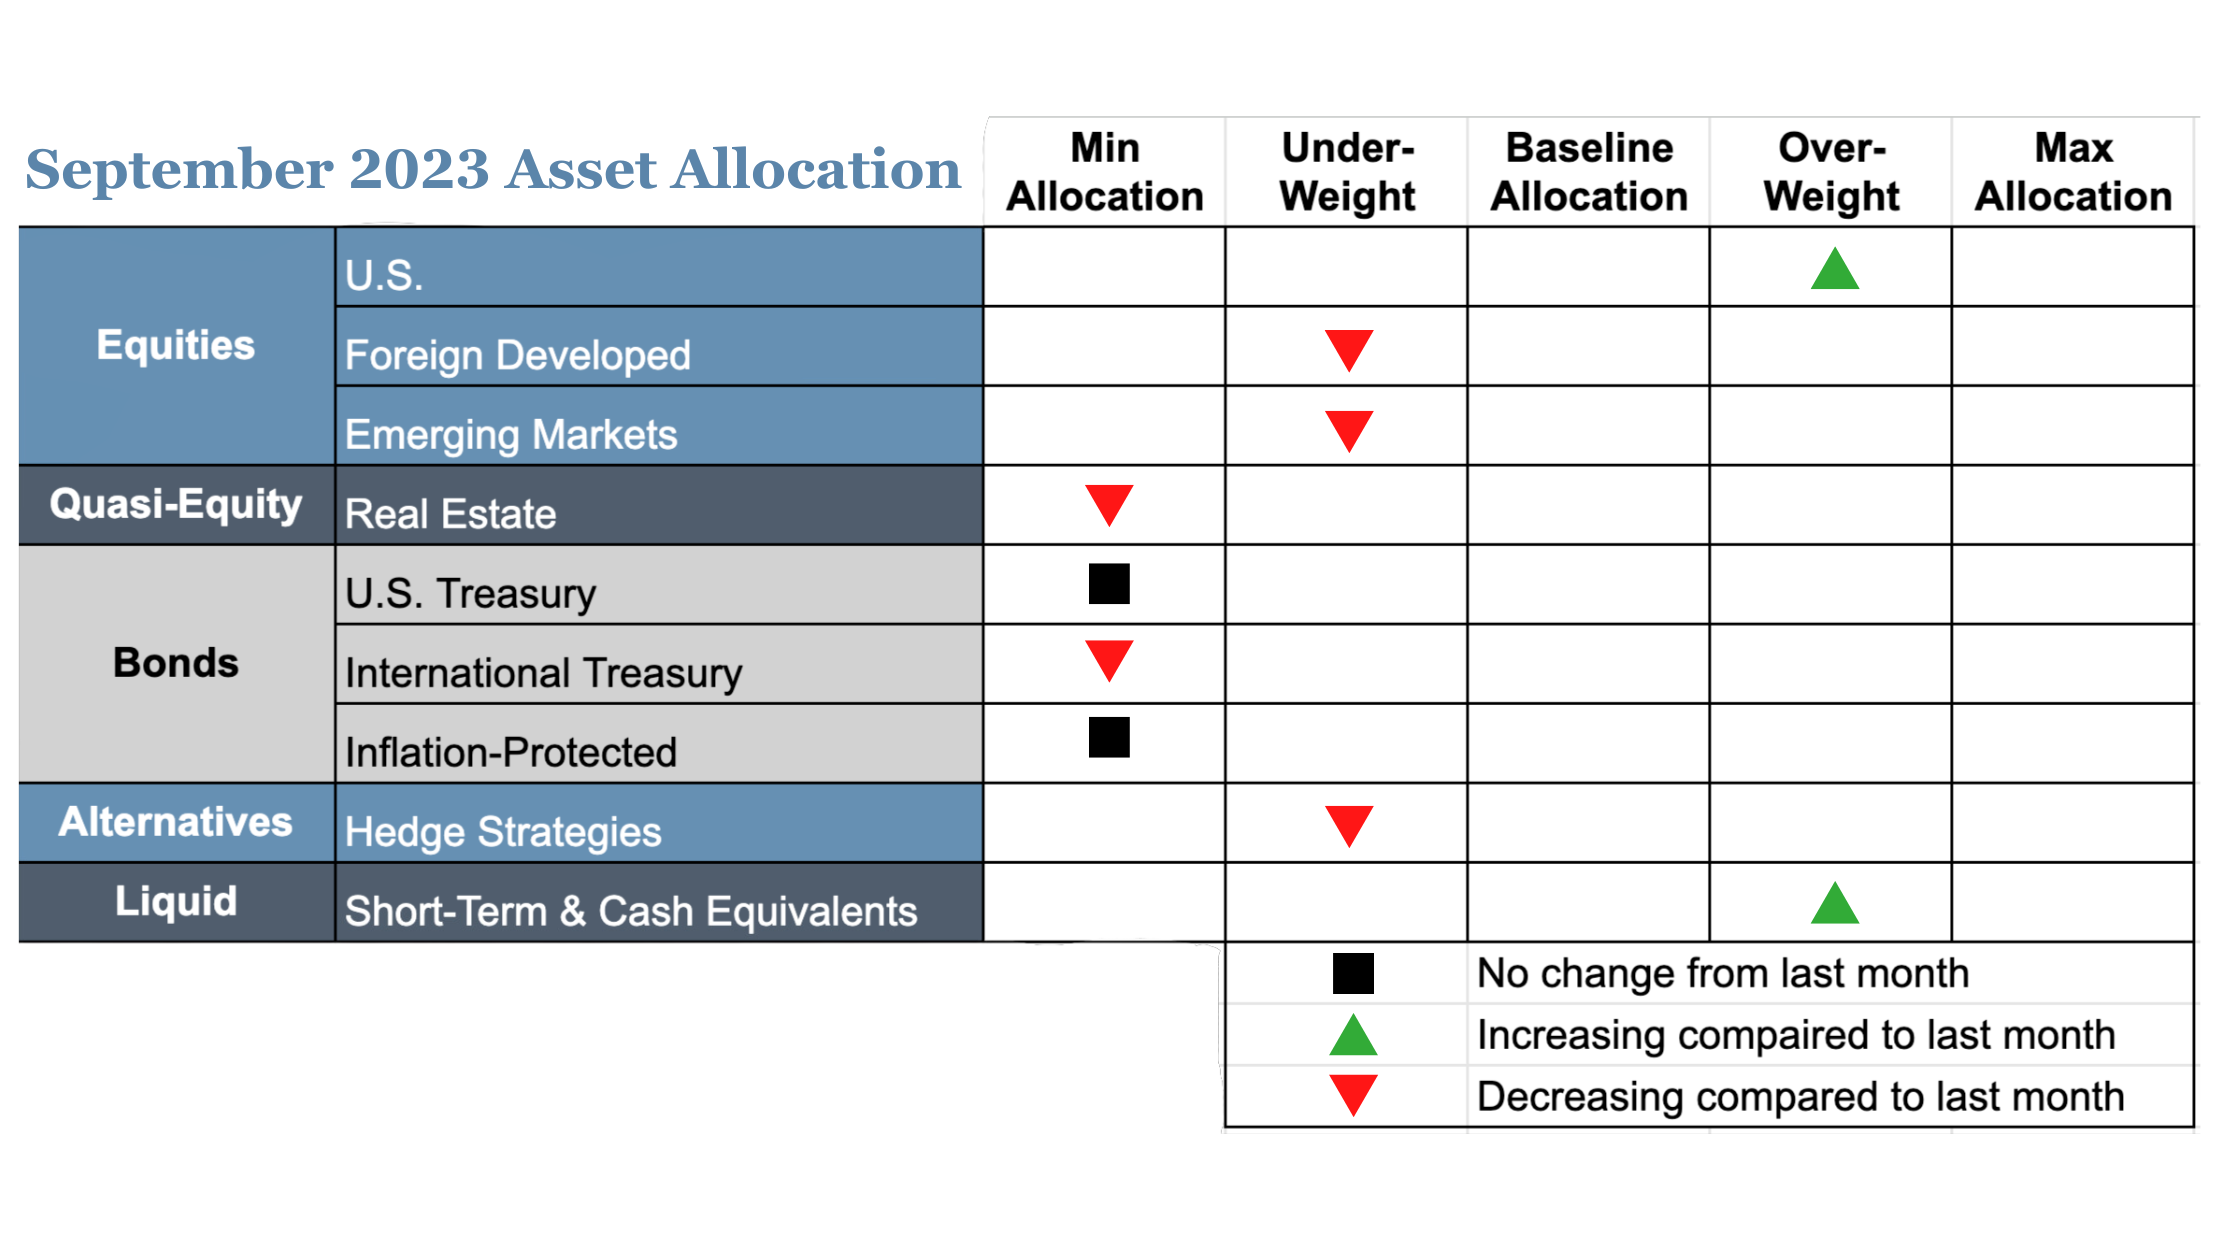
Exposure will increase. The intermediate- and long-term timeframes remain in uptrends, and equities will receive a portion of exposure from weakening international equities and real estate. Within the asset class, exposure will remain skewed toward growth and large caps, which are stronger than value, small caps, and mid caps.
Intl Equities
Exposure will decrease. Both foreign developed and emerging market equities are now experiencing intermediate-term downtrends. The long-term trends for both remain positive.
Real Estate
Exposure will decrease to its minimum allocation as the asset class returns to downtrends across both timeframes.
U.S. & Intl Treasuries
Exposure will decrease back to its minimum allocation. After a brief intermediate-term uptrend, international bonds return to downtrends across both time frames.
Inflation-Protected Bonds
Due to downtrends across both timeframes, exposure will not change and is at its minimum allocation.
Short-Term Fixed Income
Exposure will increase, as it receives allocations from weaker assets, specifically international treasuries.
Alternatives
Exposure will decrease, as gold re-enters an intermediate-term downtrend. The long-term trend remains positive.
Asset Level Overview
Equities & Real Estate
Historically, September isn’t the best time for stocks, and August confirmed this with a widespread sell-off. Growth and tech stocks took a harder hit compared to their value and dividend-focused counterparts. The U.S. stock market still maintains a positive trend despite this setback.
The global picture is less rosy. Foreign-developed equities, which were doing well in 2023, and emerging markets both shifted into medium-term downtrends. To manage risk, we’re moving our investments more toward robust U.S. equities; a strategy we discuss below. Currently, the long-term trend remains positive for international investments. This may change in September, especially for emerging markets.
Real estate recently ended its brief uptrend over the medium term. Both short and long-term trends are now negative. As a result, we’re reducing our exposure to real estate back to the minimum allocation–a level we held for most of 2022 and 2023. For now, this allocation will be directed toward U.S. equities.
Fixed Income & Alternatives
To put it mildly, fixed-income investments had a rough August. The short-lived uptrend in international fixed income quickly reversed, and we’re now allocating the minimum amount to all types of fixed income with substantial durations. As a result, we’re focusing more on ultra-short-term fixed-income instruments for exposure.
Gold faced a similar trend reversal, with the medium-term trend turning negative. Consequently, we’re reducing our gold exposure. However, the long-term trend for gold still remains positive.
Barchart.com, Growth ETF Vanguard (VUG), 8/1/2023 to 8/28/2023; Barchart.com, Nasdaq Composite ($NASX), 8/1/2023 to 8/28/2023; Barchart.com, Value ETF Vanguard (VTV), 8/1/2023 to 8/28/2023; and Barchart.com, High Dividend Yield Vanguard ETF (VYM), 8/1/2023 to 8/28/2023
3 Potential Catalysts for Trend Changes
Feeling the Pinch at the Pump:
So, you pull into the gas station, and instead of treating yourself to that extra-large Slurpee, you find yourself contemplating whether to fuel up or just walk home. Gas prices have been on a rollercoaster ride, reaching their highest levels this year. At about $3.82 per gallon of regular, it’s almost like you’re filling your tank with liquid gold. And that’s about 60 cents higher than what you were shelling out at the start of the year. These rising oil prices aren’t just pinching your wallet; they’re also giving the Federal Reserve a headache as they try to wrestle inflation down to a 2% target. Small business owners are feeling the squeeze too. They’re postponing those much-needed upgrades, watching their employees flee because they don’t want to burn their paychecks on the daily commute, and reluctantly charging you more for that cup of coffee.

Student Loan Shuffle:
Remember that student loan program that went on a pandemic-induced pause? Well, the music’s stopping, and it’s time to find a chair because the $1.6 trillion federal student loan program is revving back up. Interest will start knocking at your door as of September 1, and the first bills are due in early October. But here’s the kicker – around 40% of borrowers had their loans transferred to a new servicer, and millions of former students who enjoyed the loan holiday are now being nudged back into the game. It’s like a game of musical chairs, except some folks have never played before, and the music just got way more complicated.
The House Hunt Hurdle:
Looking for a new home lately? You’re not alone. In July, about 714,000 new homes were sold. That’s more than what we saw last June and July. When it comes to existing single-family homes, there’s a serious shortage. The National Association of Realtors tells us that only 980,000 were up for grabs in July. That’s the lowest we’ve seen in July since the days of big hair and neon leg warmers back in 1982. So, what’s the result of this real estate standoff? Skyrocketing prices for existing homes and a mad rush for new ones. Looks like finding your dream home just turned into a high-stakes game of musical chairs too!
The Wall Street Journal, “Rising Gasoline Prices Hit Inflation-Weary Americans,” 8/28/2023; The Wall Street Journal, “Student Loans Are Emerging From Deep Freeze, and Borrowers are Confused,” 8/28/2023; and The Wall Street Journal, “How High a Rate Can Housing Take?” 8/23/2023
An Ingredient For Outperformance

Clients often tell us that one of the coolest things about our tactical investment strategies is how we pass the exposure baton among different asset classes like a relay race.
Imagine we’re talking about emerging markets for a moment. In our portfolios, we have some systematic rules that tell us when it’s time to dial up or dial down our exposure to this asset class, all based on the trends it’s showing. So, if things start to look dicey and we see a downtrend forming, we’ll put on the brakes. But here’s where it gets interesting.
A lot of tactical managers would just slam on the brakes and steer everything straight into cash or something a bit more chill, like fixed income. And sure, that’s something we might do in certain situations, but we think there’s a more sophisticated way to handle it.
So, we came up with what we call our “risk handoff strategy.” It’s like a well-choreographed dance where we gracefully transition from one asset class to another.

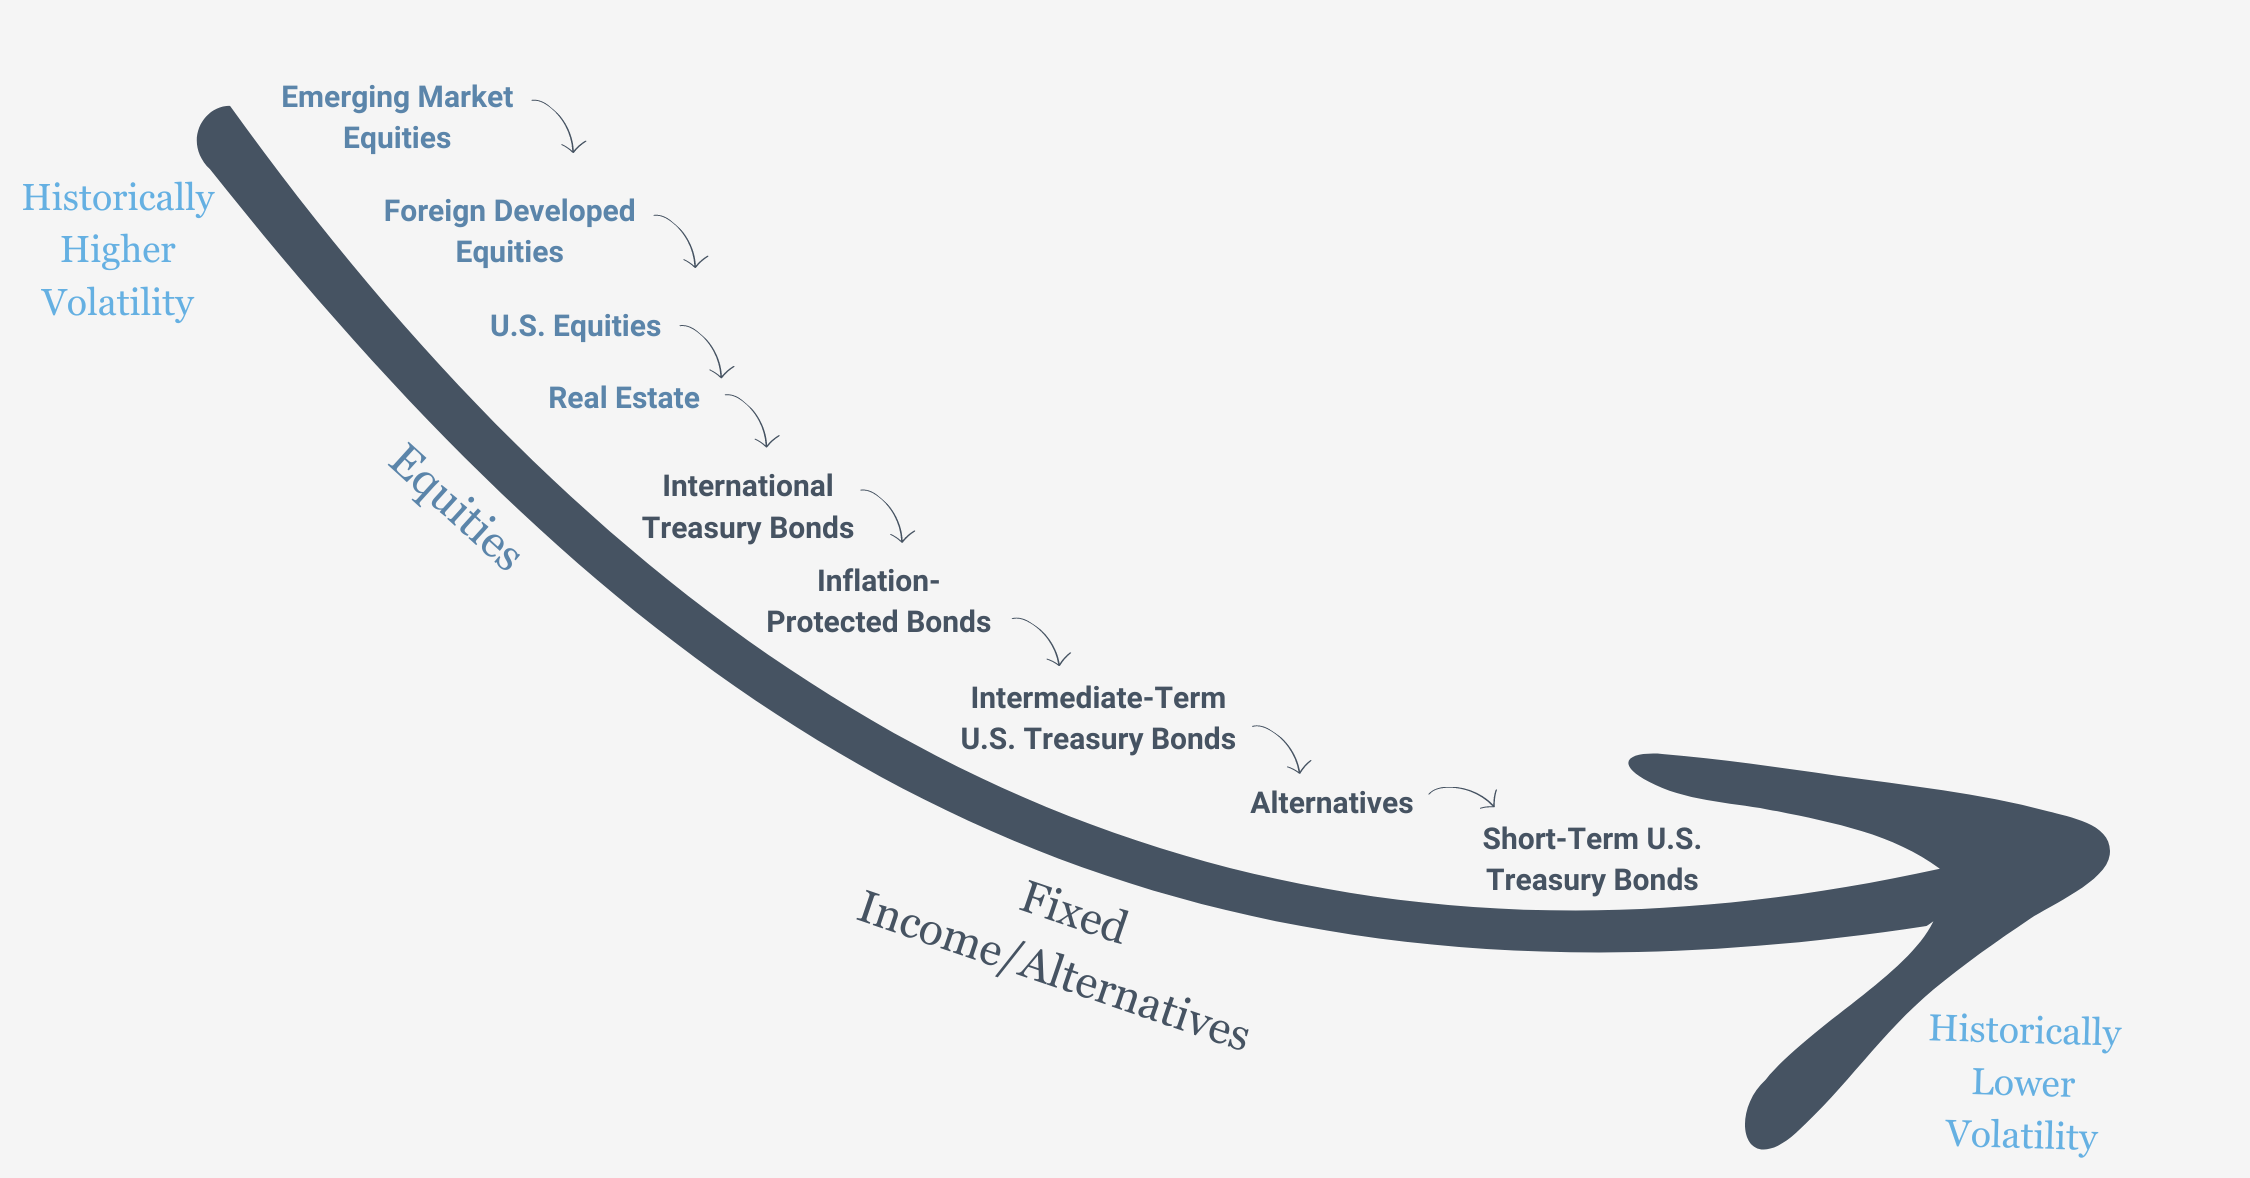
Okay, back to our emerging markets example. Instead of making a beeline for cash, we first take a look at the next best thing. Think of it like this – if emerging markets were a tropical beach, the next beach over would be foreign-developed equities. If these foreign stocks are on an uptrend, we’ll smoothly shift our exposure from the emerging markets to them. But if they’re not looking so hot, we’ll keep strolling down the beach and check out U.S. equities. We keep going until we’ve explored all our beach options, and if none of them are sunny, well, then we might finally end up in the shade of fixed income or cash.
You might wonder why we go through this whole song and dance instead of taking the shortcut to cash. This process does mean more trades and potentially some short-term capital gains. But, and it’s a big but, our entire investing approach is built on a solid foundation of research and data. We firmly believe this strategy gives us a shot at outperforming a passive benchmark (and other tactical strategies). It’s not about predicting the future; it’s about playing the odds. Trends have a funny way of sticking around longer than we expect, so why not ride the wave?
Shifting Gears: The Handoff to U.S. Equities
Now, let’s dive into a real-life example of how our strategy works. Picture this: both foreign developed and emerging market equities are showing signs of slipping, which means we’re rerouting some of that exposure to the good ol’ U.S. of A.
Over the past ten years, U.S. equities have had some major winning streaks, like a sports team on a hot streak:
• U.S. – almost 200% return (Total Stock Market ETF Vanguard, VTI)
• Foreign developed – 53% return (FTSE Developed Markets Vanguard, VEA)
• Emerging markets – 32% return (FTSE EM ETF Vanguard, VWO)
Compare those sky-high numbers to the US Aggregate Bond Ishares Core ETF (AGG), which clocked in at a mere 12%. See where we’re going with this? By nimbly shifting our exposure over time to the strongest asset classes, rather than hastily jumping into fixed income, we’re unlocking the potential for serious growth. It’s like knowing when to switch from a bicycle to a rocket ship. And that’s where our trend-following approach truly shines.
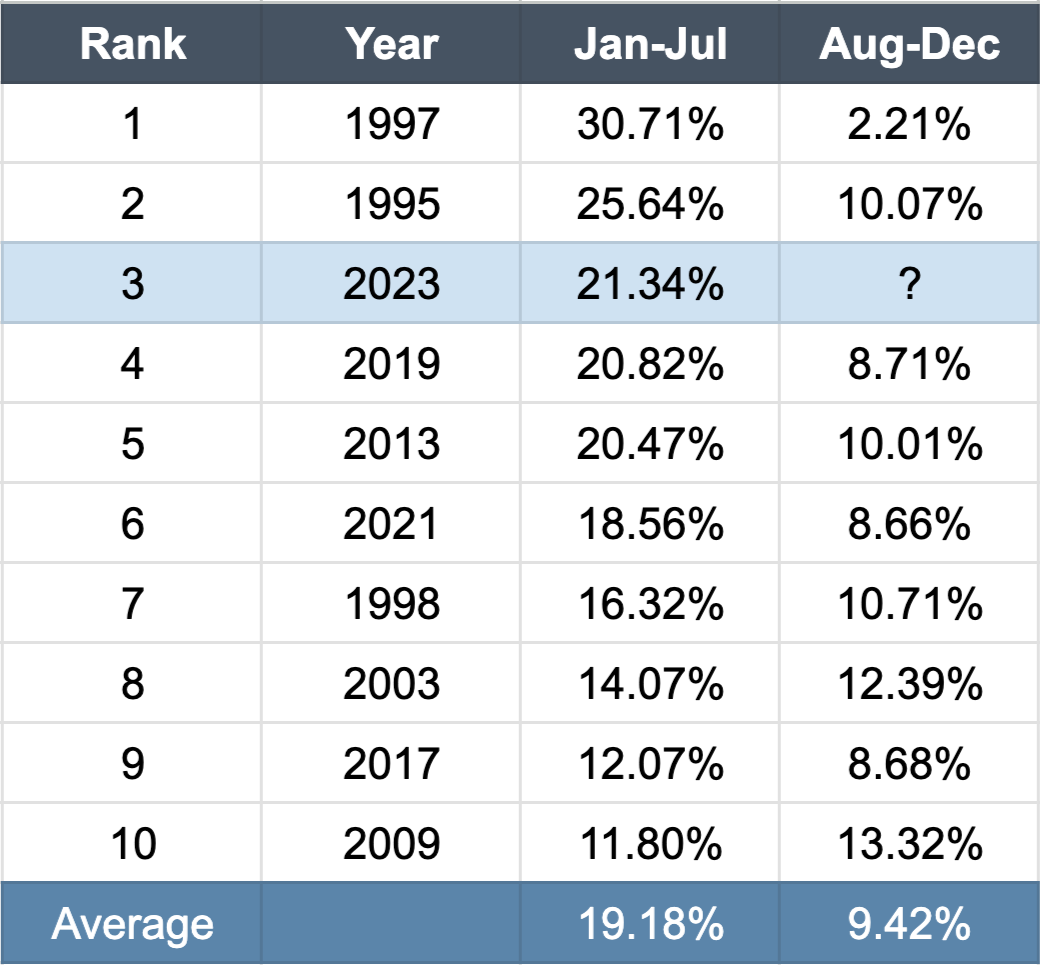
Now, let’s talk short-term. In last month’s note, we spilled the beans about 2023 being the third-best start for the S&P 500 in 30 years. And here’s a little tidbit for you: when years kick off this strong, the average return for the rest of the year is a cool 9.4%, just like we showed you in this handy graphic:
Best Starts to the Year for the S&P 500


Source: GFD, SPY, 2/1/1993 to 7/26/2023
Given our trusty U.S. equities’ track record of outperforming their international buddies in both quick sprints and marathon races, we’re confident in giving international equity exposure a breather right now; especially when emerging markets and foreign developed stocks are taking a breather themselves. Sure, it doesn’t come with a guarantee stamped on it, but we prefer sticking to a well-thought-out process over hoping for lady luck to grace us with her presence.
Remember, we often say that if you want different results, you’ve got to be willing to take a different route. Our risk handoff strategy is a perfect example of this mantra. Being different can be a little nerve-wracking, but the payoff comes from watching our approach stand the test of time and guiding our clients steadily toward their financial goals.
Barchart.com, Total Stock Market ETF Vanguard (VTI), 9/1/2014 to 8/28/2023; Barchart.com, FTSE Developed Markets Vanguard (VEA), 9/1/2014 to 8/28/2023; Barchart.com, FTSE EM ETF Vanguard (VWO), 9/1/2014 to 8/28/2023; and Barchart.com, US Aggregate Bond Ishares Core ETF (AGG), 9/1/2014 to 8/28/2023
Disclosures:
Strategic Advisory Partners is an investment advisor registered pursuant to the laws of the state of North Carolina. Our firm only conducts business in states where licensed, registered, or where an applicable exemption or exclusion is afforded. This material should not be considered a solicitation to buy or an offer to sell securities or financial services. The investment advisory services of Strategic Advisory Partners are not available in those states where our firm is not authorized or permitted by law to solicit or sell advisory services and products. Registration as an investment adviser does not imply any level of skill or training. The oral and written communications of an adviser provide you with information about which you determine to hire or retain an adviser. For more information, please visit adviserinfo.sec.gov and search for our firm name.
Past performance is not indicative of future results. The material above has been provided for informational purposes only and is not intended as legal or investment advice or a recommendation of any particular security or strategy. The investment strategy and themes discussed herein may be unsuitable for investors depending on their specific investment objectives and financial situation.
Information obtained from third-party sources is believed to be reliable though its accuracy is not guaranteed.
Opinions expressed in this commentary reflect subjective judgments of the author based on conditions at the time of writing and are subject to change without notice.
No part of this material may be reproduced in any form, or referred to in any other publication, without express written permission from Strategic Advisory Partners.
An index is an unmanaged portfolio of specific securities, the performance of which is often used as a benchmark in judging the relative performance of certain asset classes. Investors cannot invest directly in an index. An index does not charge management fees or brokerage expenses, and no such fees or expenses were deducted from the performance shown.

